Sampling distributions, standard error, and 95% continence intervals
Sampling distributions
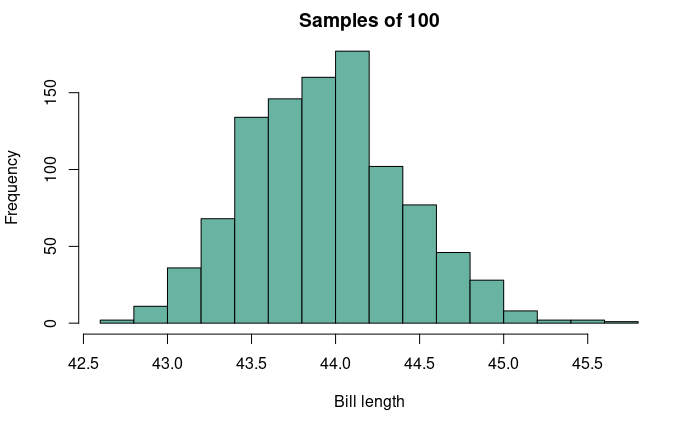
Estimate: an inference about a population parameter based on a subsample of that population. Since samples are only a subset of the entire population, there is a chance that estimates from repeated sampling from that population can be off by a particular amount. We can visualize this uncertainty by plotting a sampling distribution.
For this figure, the true population mean is 43.92 mm.
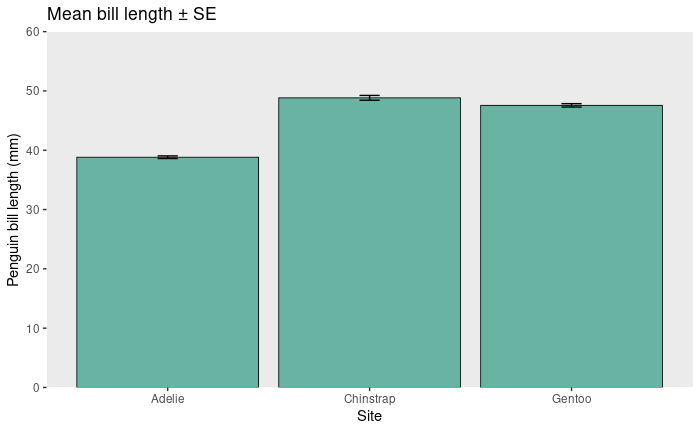
Standard error: The standard deviation of the sampling distribution.


95% confidence interval: the range likely to contain the true population mean.


This file contains bidirectional Unicode text that may be interpreted or compiled differently than what appears below. To review, open the file in an editor that reveals hidden Unicode characters.
Learn more about bidirectional Unicode characters
| # Dealing with uncertainty in R | |
| library(palmerpenguins) | |
| data(penguins) | |
| penguins <- na.omit(penguins) | |
| # If we want to calculate 95% CI using the 2SE convention: | |
| species <- NULL | |
| means <- NULL | |
| std_devs <- NULL | |
| sizes <- NULL | |
| sems <- NULL | |
| cis <- NULL | |
| # Counter | |
| k <- 1 | |
| for (i in levels(penguins$species)) { | |
| x <- penguins$bill_length_mm[penguins$species == i] | |
| means[k] <- mean(x) | |
| std_devs[k] <- sd(x) | |
| sizes[k] <- length(x) | |
| sems[k] <- std_devs[k] / sqrt(sizes[k]) | |
| cis[k] <- paste(means[k] – 2 * sems[k], means[k] + 2 * sems[k], sep = ",") | |
| species[k] <- paste(i) | |
| k <- k + 1 | |
| } | |
| results <- data.frame(species, sizes, means, std_devs, sems, cis) | |
| names(results) <- c("species", "n", "mean", "sd", "se", "ci") | |
| print(results) | |
| # Mean, standard deviation, standard error, and 95% confidence intervals using **t-distribution** | |
| library(Rmisc) | |
| rmisc_results <- summarySE(penguins, measurevar = "bill_length_mm", groupvars = "species") | |
| ci_lower <- rmisc_results$bill_length_mm – rmisc_results$ci | |
| ci_upper <- rmisc_results$bill_length_mm + rmisc_results$ci | |
| print(paste(ci_lower, ci_upper, sep = ",")) |
This file contains bidirectional Unicode text that may be interpreted or compiled differently than what appears below. To review, open the file in an editor that reveals hidden Unicode characters.
Learn more about bidirectional Unicode characters
| # Dealing with uncertainty in Python | |
| import pandas as pd | |
| import numpy as np | |
| from scipy.stats import t | |
| from palmerpenguins import load_penguins | |
| penguins = load_penguins().dropna() | |
| # Split the data frame into groups | |
| groups = penguins.groupby('species') | |
| # Calculate sample means, standard deviations, and standard errors for each group | |
| means = groups['bill_length_mm'].mean() | |
| std_devs = groups['bill_length_mm'].std() | |
| sizes = groups['bill_length_mm'].size() | |
| sems = groups['bill_length_mm'].sem() | |
| # Calculate 95% CIs for each group | |
| cis = {} | |
| for group, mean, std_dev, size, sem in zip(means.index, means, std_devs, sizes, sems): | |
| ci_1 = mean – (2 * sem) | |
| ci_2 = mean + (2 * sem) | |
| cis[group] = ci_1, ci_2 | |
| print(cis) | |