Describing data

Mean: the average measurement from a sample

ȳ = sample mean
Σ = sum
yi = ith observation
n = sample size

Changing scale

y’ = converted measurement
y = original measurement
c = conversion factor

Variance (s2) and standard deviation (s): the spread of the measurements

Numerator of variance equation is called the “sum of squares” and is the basis of most basic statistics.

Median: middle measurement in a sorted list of all measurements (similar utility as the mean)

Interquartile range: middle 50% of the measurements (similar utility as standard deviation). Special rules for calculating quartiles included in lesson .Rmd

First quartile

Median

Third quartile
# Calculating mean, and other summary statistics in R with examples
# Set up
library(palmerpenguins)
data(penguins)
penguins <- na.omit(penguins)
# Mean
mean(penguins$bill_length_mm)
# Meadian
median(penguins$bill_length_mm)
# Mean, median and quartiles
summary(penguins$bill_length_mm)
# Variance
var(penguins$bill_length_mm)
# Standard deviation
sd(penguins$bill_length_mm)
R code
# Calculating mean, and other summary statistics in Python with examples
import pandas as pd
import numpy as np
from palmerpenguins import load_penguins
penguins = load_penguins()
bill_length_mm = penguins['bill_length_mm'].dropna()
# Sample mean
mean = np.mean(bill_length_mm)
# Sample standard deviation
std_dev = np.std(bill_length_mm)
# Sample size
n = len(bill_length_mm)
# Summary stats using pandas
print(bill_length_mm.describe())
Python code

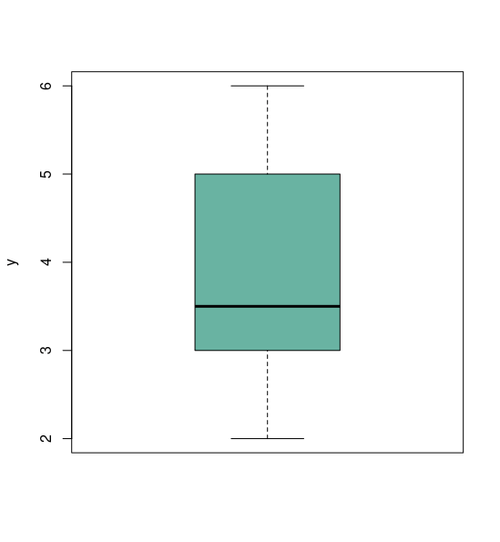
Box plot: displays the median as well as the interquartile range.

Proportions: the relative amount of a particular measurement from a particular group.