Figures are a great way to present data visually. However, there are some important rules to follow when choosing and building plots.
Simple rules to follow when creating plots
- Make sure the data is visible – simple plots are typically better than overly complex ones
- Display patterns in the data clearly
- Be honest, accurately portray the magnitude of changes (i.e. don’t over exaggerate your results)
- Draw your plot clearly, excess stylistic components can hurt instead of help your presentation and use reasonably sized fonts
Types of plots
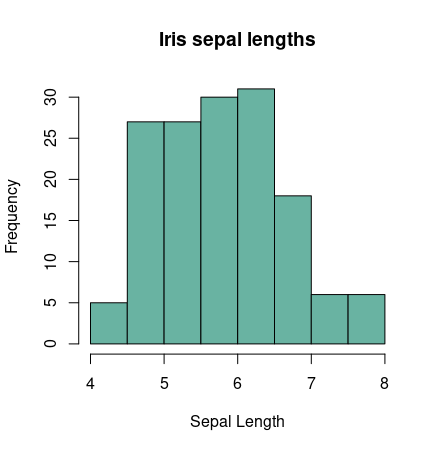
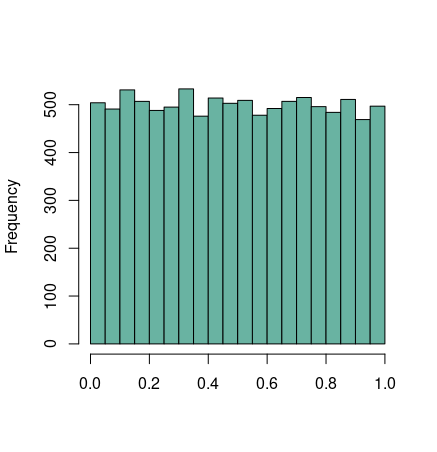
Histograms
Histograms are used to represent the frequency of observations for a single variable. The shape of the histogram provides a lot of information about that particular variable. They are also used for testing assumptions of certain statistical tests.
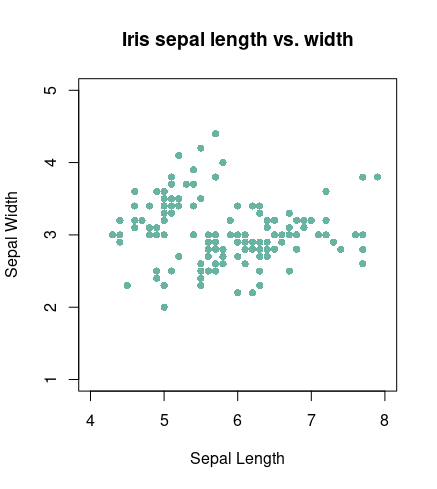
Point (scatter) plot
This is one of the simplest and most common way to represent numerical data. In its most basic form, each point is a single observation at a given x and y value.
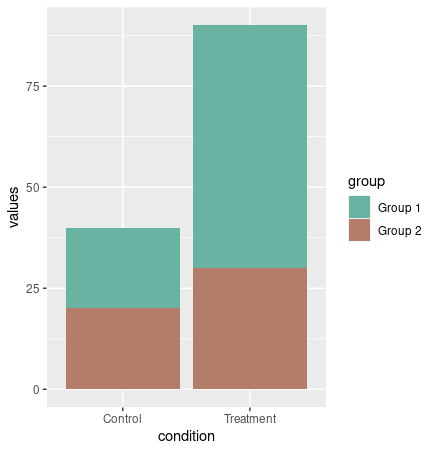
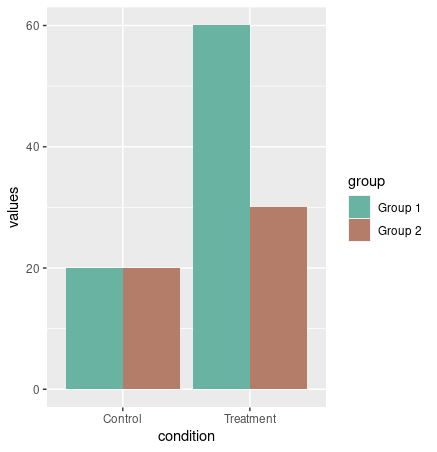
Bar plots
Bar plots can be used to show associations between categorical variables. Bars can either be stacked or side-by-side.
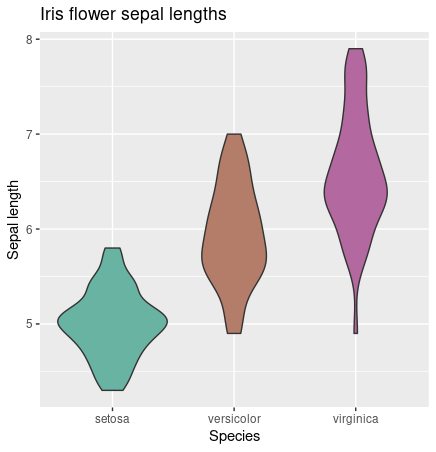
Violin plots
These plots show the frequency in observations within different groups. Sort of like sideways histograms.
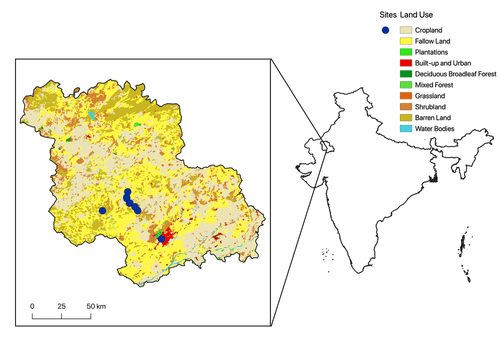
Maps
Maps can be used to convey data. For example, this map is made up of colored cells that represent different types of land use.
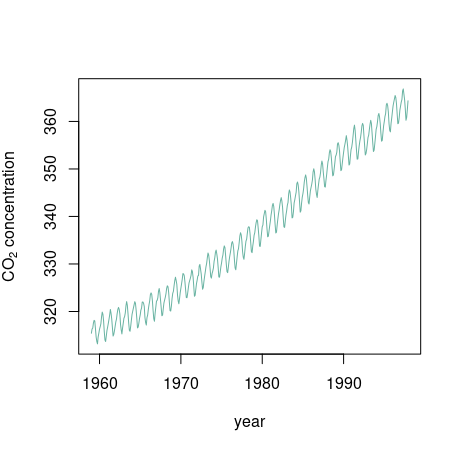
Time series
These plots show the changes of a variable over time.
Simple rules to follow when creating tables
- Display patterns in the data clearly
- Be honest, accurately portray the magnitude of changes (i.e. don’t over exaggerate your results)
- Draw your table clearly, excess stylistic components cn hurt instead of help your presentation and use reasonably sized fonts
| Borough | Subway Stations | Stations near green spaces | Total borough area (km2) | Total green area (km2) |
|---|---|---|---|---|
| Manhattan | 152 | 64 | 58.60 | 10.36 |
| Brooklyn | 167 | 38 | 180.24 | 15.43 |
| Queens | 80 | 18 | 282.30 | 21.50 |
| Bronx | 71 | 20 | 108.86 | 22.69 |
| Staten Island | 0 | 0 | 150.87 | 25.97 |


Tables in RMarkdown uses Markdown syntax. You can check out the Markdown cheat sheet here.